RANDOM NUMBERS
Contents
RANDOM NUMBERS#
The RANDOM NUMBERS content is designed so that the participant can exploit the computer’s ability to perform various operations quickly.
This is an important paradigm shift that forces the participant to move from solving problems analytically to solving problems computationally. Therefore, avoid as much as possible to answer the proposed questions using combinatorial analysis.
The proposed problems are:
Rolling a Dice 🟢
Tossing Coins 🟡
Random Password 🟠
A very important concept related to random numbers is the probability distribution. So before moving on, at least take a look (below) at some distributions.
Take the opportunity to reflect on how important it is to choose the random function correctly.
Probability distribution#
import random
import seaborn as sns
sns.set_theme()
Uniform Distribution#
# INTEGER
distribution = [random.randint(1, 100) for _ in range(1000000)]
sns.histplot(data=distribution, bins=100)
<AxesSubplot:ylabel='Count'>

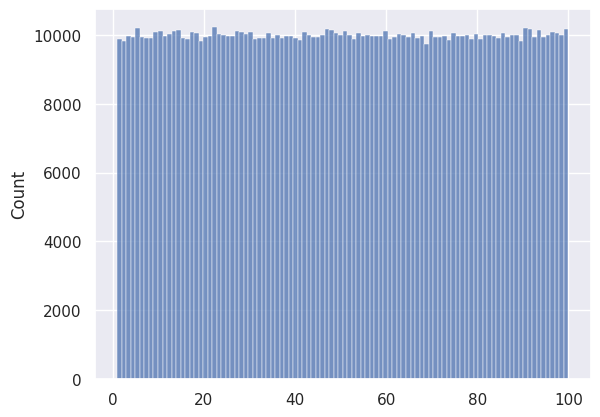
# REAL
distribution = [random.uniform(1, 100) for _ in range(1000000)]
sns.histplot(data=distribution)
<AxesSubplot:ylabel='Count'>
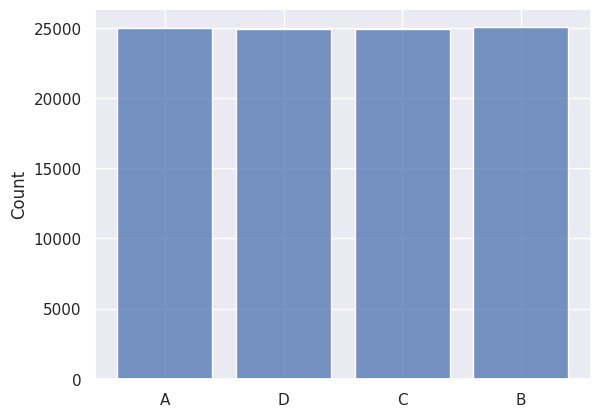
# SEQUENCE
distribution = random.choices(['A','B', 'C', 'D'], k=100000)
sns.histplot(data=distribution, shrink=.8)
<AxesSubplot:ylabel='Count'>
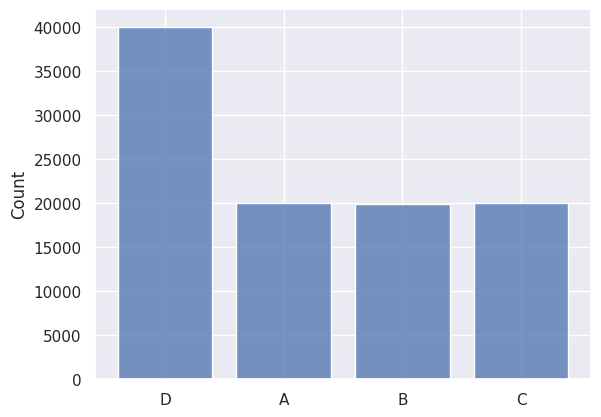
Weighted#
distribution = random.choices(['A','B', 'C', 'D'], weights=[1,1,1,2], k=100000)
sns.histplot(data=distribution, shrink=.8)
<AxesSubplot:ylabel='Count'>
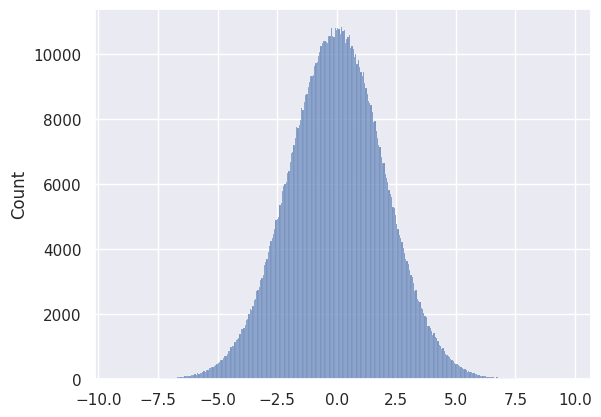
Gaussian#
distribution = [random.gauss(0, 2) for _ in range(1000000)]
sns.histplot(data=distribution)
<AxesSubplot:ylabel='Count'>
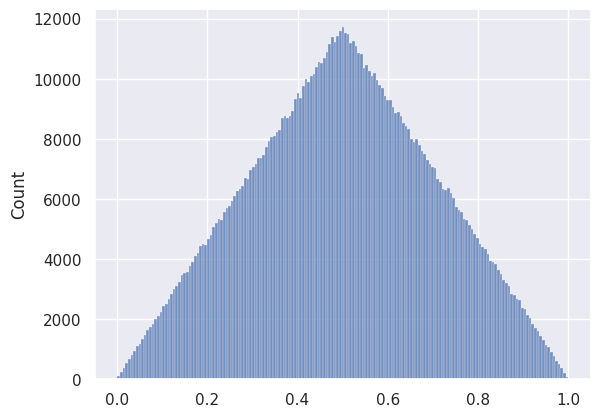
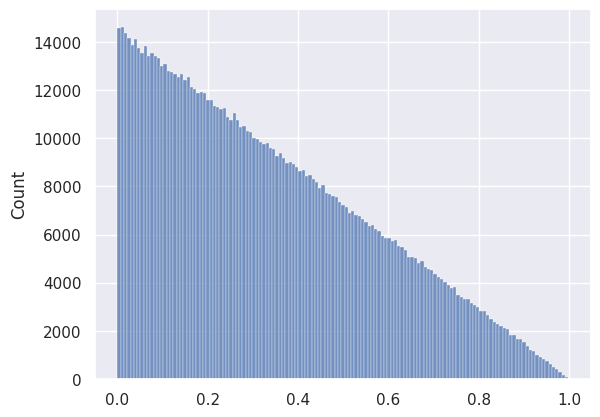
Others#
distribution = [random.triangular() for _ in range(1000000)]
sns.histplot(data=distribution)
<AxesSubplot:ylabel='Count'>
distribution = [random.betavariate(1,2) for _ in range(1000000)]
sns.histplot(data=distribution)
<AxesSubplot:ylabel='Count'>
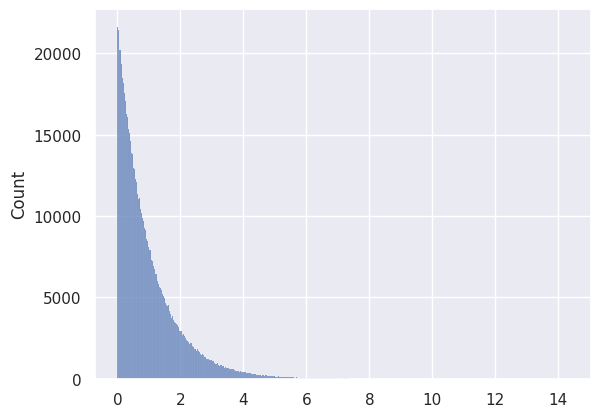
distribution = [random.expovariate(1) for _ in range(1000000)]
sns.histplot(data=distribution)
<AxesSubplot:ylabel='Count'>